KubeSlice


Avesha Enterprise for KubeSlice
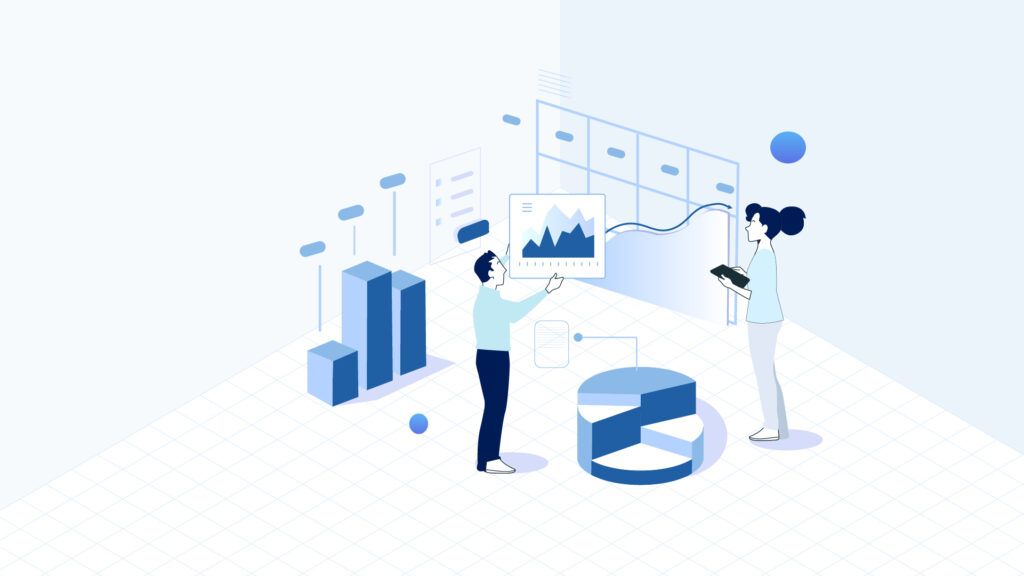
Service Connectivity Layer for managing fleet of clusters for better application performance
Smart Scaler
Smart Scaler
Predictive autoscaling based on application behaviors
Elastic Grid Service


EGS
Single/Multi-cluster and multi-cloud GPU provisioning and management platform
1.16
KubeSlice Enterprise
released version 1.16.0
2.17
Smart Scaler
released version 2.17.0
1.16
Elastic Grid Service
released version 1.16.0


EGS Resources
Explore Resources for Elastic Grid Service

Analyst Reports
Navigating Key Metrics for Growth and Success

Blog
Source for Trends, Tips, and Timely Topics

Documentation
The Blueprint for Mastering Tools and Processes

Customer Case Studies
Success stories from our valued customers and partners


Avesha Resources / Blogs
Why central observability?
Simplifying Hybrid Kubernetes Deployments with Unified Observability and Self-Service Application Slicing.

Raj Nair
Founder & CEO
Background:
Organizations undertaking modernization must support a hybrid deployment model where data and workloads often have to be in different locations — near premises (data center or edge) and public cloud. For compliance, data sometimes needs to be in a certain geography to meet regulations &
security standards. Certain public clouds offer special processing advantages for certain workloads. Thus, to address these scenarios, workloads need to be able to be deployed across locations and yet have observability to help manage and troubleshoot fault conditions.
Challenges:
Current tools for observability are focused on single cluster deployments and require the operator to correlate using logs from multiple clusters to develop a comprehensive view of the end-to-end picture. This makes it difficult to pinpoint trouble spots and identify issues. Clearly, this is not a good way to
operate production infrastructures and has contributed to growth of very large single clusters that have stifled the development of applications that truly need to be distributed as described above.
Solution:
An important tenet of a distributed deployment is the need to have a single pane of glass to observe a distributed deployment. An “application slice” (available in Avesha’s KubeSlice product) is a building block to make Kubernetes infrastructure manageable with focussed visibility. Avesha’s KubeSlice Manager product achieves this objective by offering a slice-wide view of a deployment that shows what is happening across a slice from one place. This includes information about inter-service traffic via the tunnel endpoints represented as Sankey graphs for bandwidth and inter-service latency via a hub controller fed from Service Mesh (e.g. Linkerd or Istio). KubeSlice Manager product is a self-service product to allow application developers to create application slices and multi-cluster namespaces on their own without any assistance from devops or netops teams. Once installed, the KubeSlice allows the platform team to templatize clusters and set slice limits in a scalable manner.


Copied